OPA3 Supports Pancreatic Tumor Growth Through Context-Dependent Metabolic and Hypoxic Adaptation
1 State Key Laboratory of Oncology in South China, Collaborative Innovation Center for Cancer Medicine, Sun Yat-sen University Cancer Center, Guangzhou, China.
2 Department of Radiation Oncology, Sun Yat-sen University Cancer Center, Guangzhou, China.
3 Guangzhou Biotron Technology Co., Ltd., Guangzhou, China.
4 Laboratory of Clinical and Molecular Gastroenterology, Institute for Digestive Research, Lithuanian University of Health Sciences, Kaunas, Lithuania
Correspondence: Christophe Glorieux (christophe.glorieux@lsmu.lt)
* Equal contributors to this work.
Received: July 14, 2026
Accepted: September 14, 2026
Published: November 15, 2026
© 2026 The Author(s). Published by GCINC Press, Spokane, Washington, United States. Open Access licensed under a Creative Commons Attribution 4.0 International License (CC BY 4.0), which permits unrestricted use, distribution, and reproduction in any medium, provided the original author(s) and source are credited. To view a copy of this license, visit: Creative Commons Attribution 4.0 International License (CC BY 4.0)
Abstract
Background: Optic atrophy protein 3 (OPA3) regulates mitochondrial function, but its contribution to cancer progression and adaptation to hypoxic tumor microenvironments remains incompletely understood.
Methods: We examined OPA3 expression across 31 cancer types and investigated its function using CRISPR/Cas9 knockout in five cancer cell lines with different KRAS backgrounds. Proliferation, clonogenic growth, mitochondrial metabolism, and ATP production were evaluated in vitro. Pancreatic cancer xenografts, hypoxia experiments, and spatial transcriptomic analyses were used to assess tumor growth and HIF-1α-associated responses.
Results: OPA3 expression varied across cancer types. OPA3 knockout preferentially impaired proliferation and clonogenic growth in the KRAS-mutant cell lines examined, with reduced mitochondrial respiration and ATP production observed in PANC-1 cells. Despite limited effects on KRAS-wild-type BxPC-3 cells in vitro, OPA3 depletion suppressed both PANC-1 and BxPC-3 xenograft growth. Under prolonged hypoxia, OPA3-deficient cells exhibited reduced HIF-1α protein accumulation and impaired clonogenic growth. Spatial transcriptomic analyses identified a positive association between OPA3 and HIF1A expression in pancreatic tumor-associated tissues. However, these observations do not establish direct HIF-1α stabilization or a causal relationship in human tumors.
Conclusions: OPA3 supports pancreatic tumor growth through context-dependent processes associated with mitochondrial metabolism and hypoxic adaptation. Its effects extend beyond KRAS mutation status in xenograft models, although the underlying mechanisms require further validation. These findings identify OPA3 as a candidate regulator of tumor-microenvironment adaptation rather than an established therapeutic target.
Keywords
OPA3; pancreatic cancer; mitochondrial metabolism; tumor hypoxia; HIF-1α; KRAS; tumor microenvironment.
1. Introduction
Cancer progression partly depends on malignant cells' ability to adapt their metabolism and survival programs to changing microenvironmental conditions (1, 2). In this context, we demonstrated that Optic Atrophy Protein 3 (OPA3) expression is upregulated in human pancreatic tumor tissues and is regulated by oncogenic KRAS (Kirsten rat sarcoma viral oncogene homolog) signaling (3). Genetic knockdown of OPA3 significantly decreased energy metabolism and inhibited cell proliferation. Our findings indicate that OPA3 can promote cellular energy metabolism to offset KRAS-mediated mitochondrial impairment, thereby maintaining energy homeostasis (3).
OPA3 was initially implicated in hereditary optic neuropathies through the identification of disease-associated mutations, establishing its importance in mitochondrial homeostasis and cellular function (4, 5). OPA3 localizes to the outer mitochondrial membrane, where it has been implicated in mitochondrial fragmentation and the regulation of mitochondrial morphology. Experimental studies further demonstrated that OPA3 expression can sensitize HeLa cervical cancer cells to apoptosis induced by agents such as staurosporine, suggesting a potential role in cellular stress responses (6). Beyond these mitochondrial functions, emerging evidence indicates that OPA3 expression is altered in several malignancies, including pancreatic, ovarian, colorectal, and squamous cell cancers, although its biological effects vary across tumor types and experimental models (3, 7–9). These findings suggest that OPA3 may influence tumor-cell behavior through mechanisms that depend on cellular and molecular context. In contrast to studies supporting a tumor-promoting role, OPA3 overexpression has been reported to alter lipid droplet formation, suppress colorectal cancer cell proliferation, and increase sensitivity to bevacizumab (10). These observations highlight the heterogeneous functions of OPA3 in cancer and underscore the need to define the conditions that determine its effects on tumor progression.
Despite emerging evidence linking OPA3 to several malignancies, its context-dependent functions and underlying molecular mechanisms remain poorly understood. In the present study, our findings indicate that OPA3 depletion impaired cell proliferation capacity and cellular metabolism in mutant KRAS-expressing cancer cell lines, but not in cells harboring wild-type KRAS. Notably, OPA3 knockout also suppressed tumor growth in both KRAS-mutant PANC-1 and KRAS-wild-type BxPC-3 xenografts, with reduced HIF-1α protein abundance observed in BxPC-3 tumors. These findings suggest that OPA3 may contribute to tumor growth through mechanisms associated with hypoxic adaptation, although a causal role for HIF-1α remains to be established.
2. Results
OPA3 expression is dysregulated across human cancers
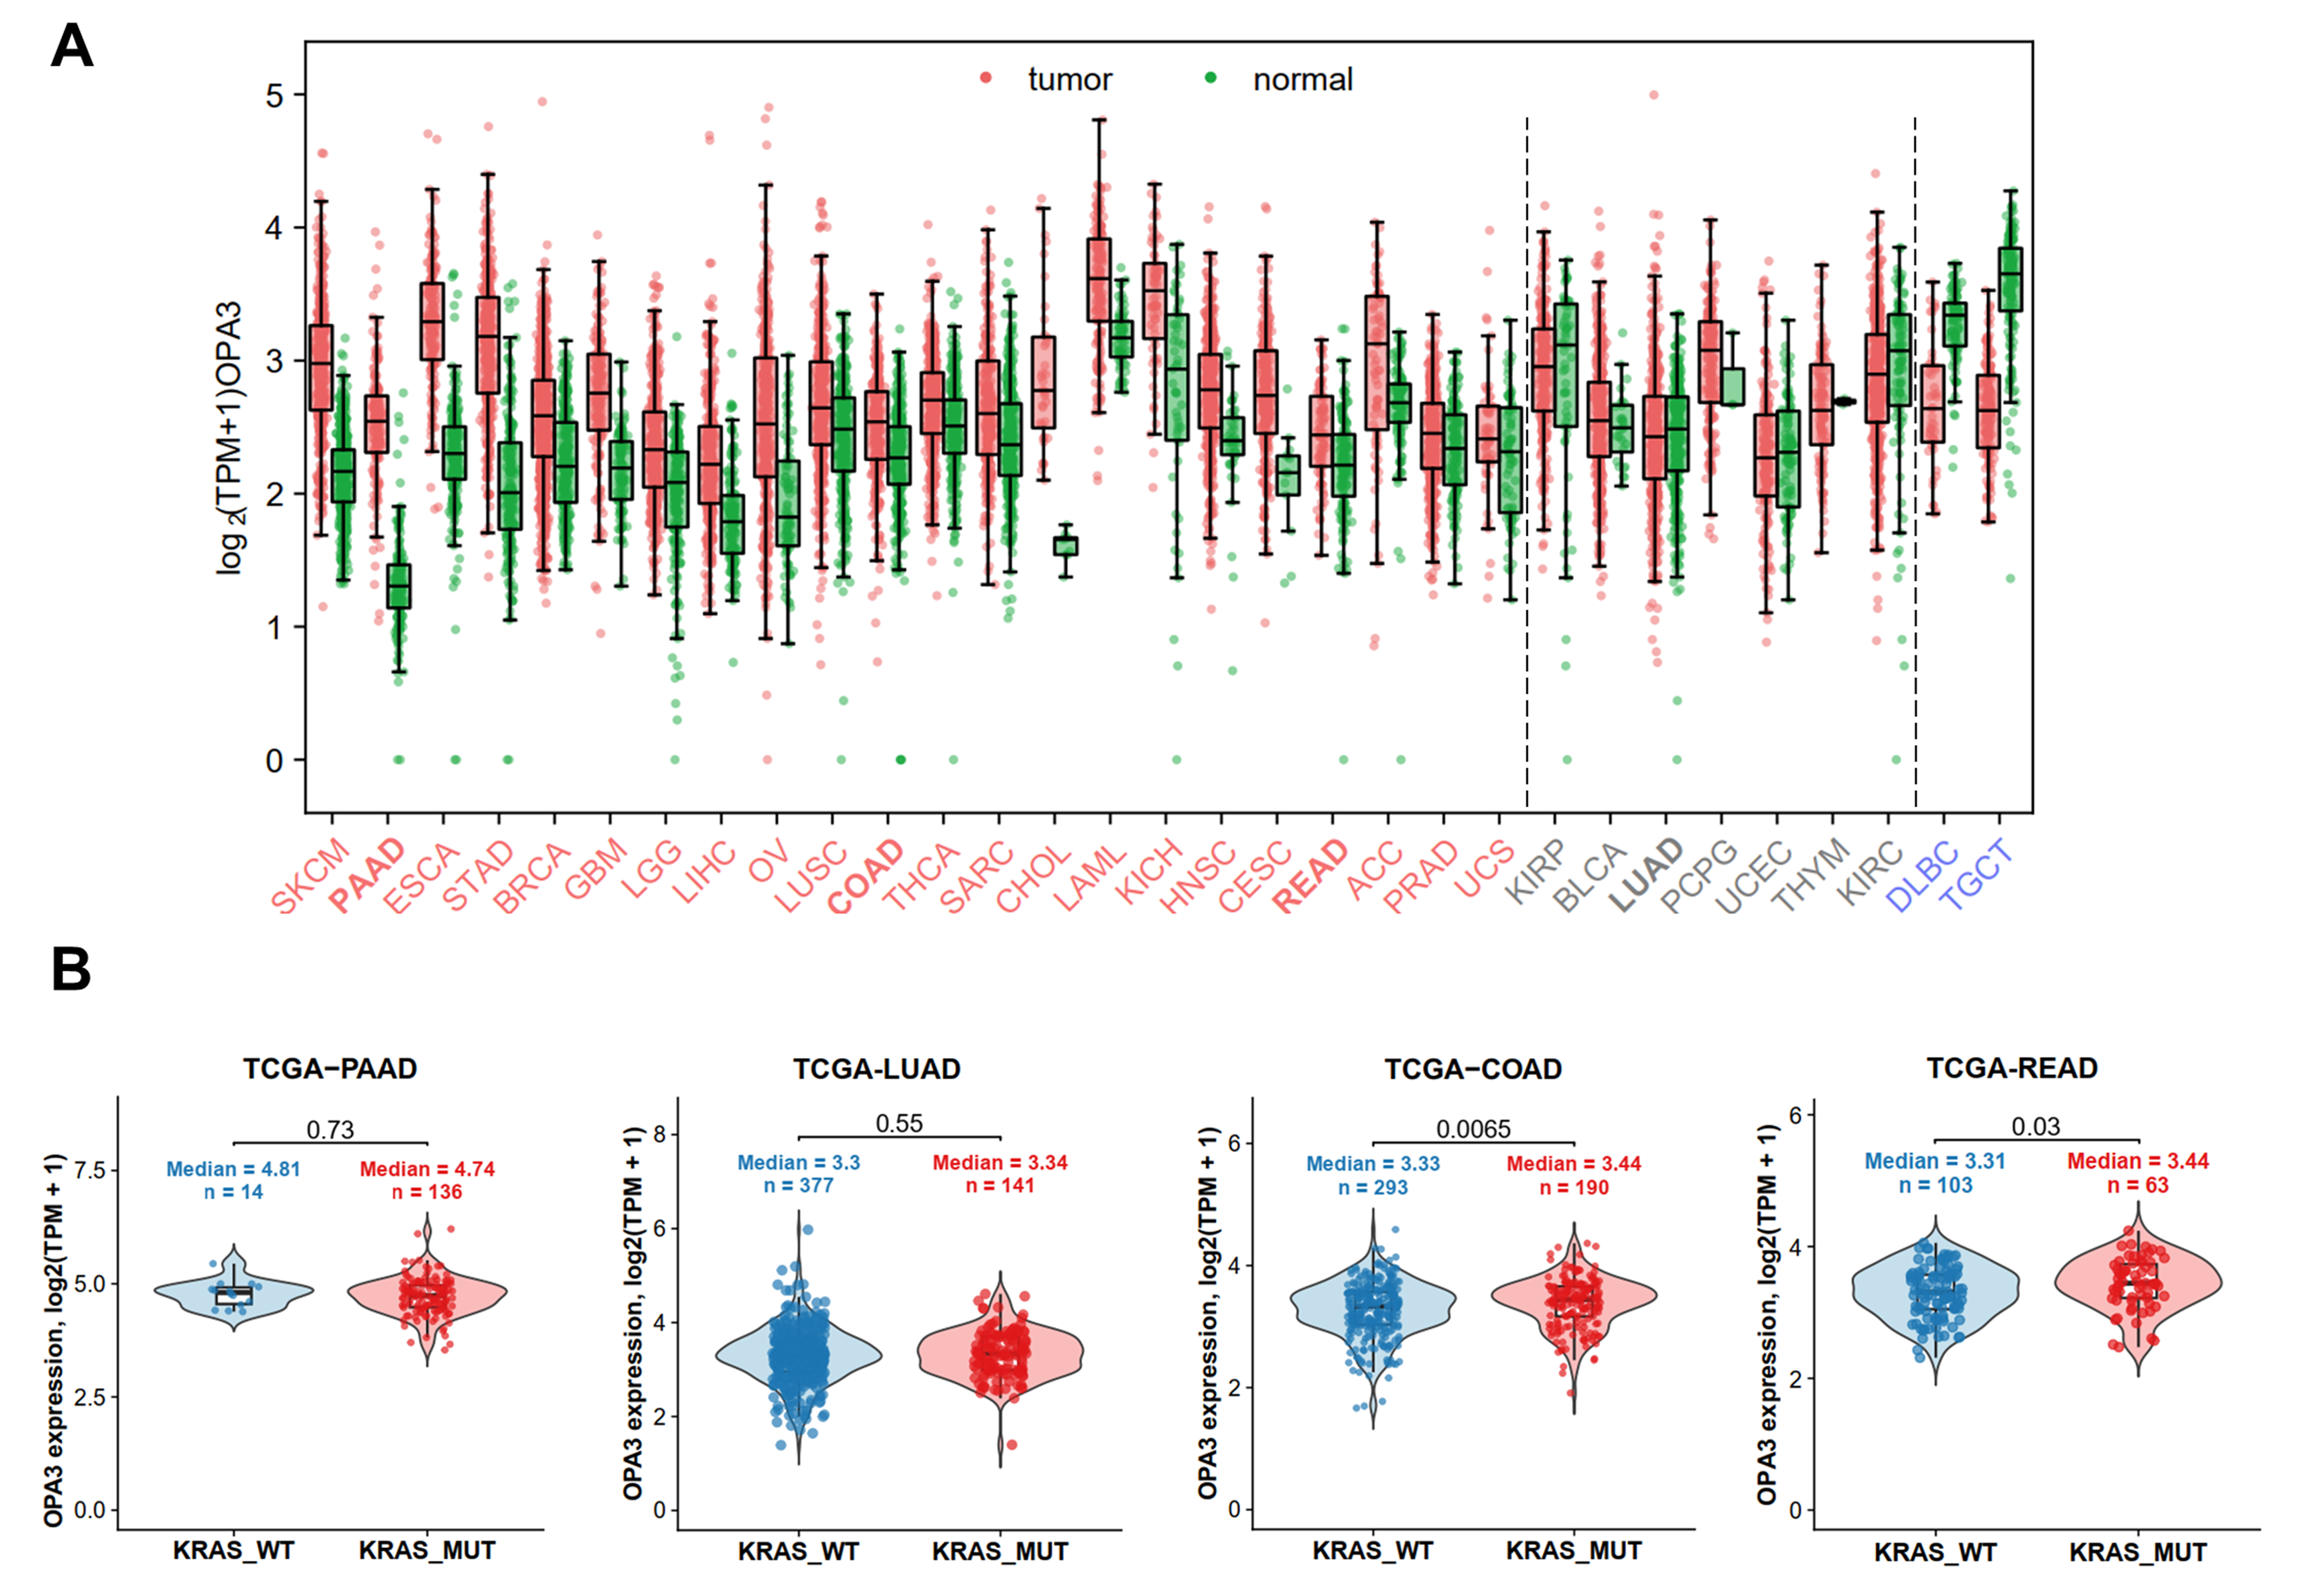
Building on our previous study (3), we first characterized OPA3 expression patterns across human cancers and assessed whether KRAS mutation status affects its expression. We compared OPA3 expression between tumor and corresponding normal tissues across 31 cancer types using GEPIA. OPA3 expression showed heterogeneous tumor-normal patterns among different malignancies, indicating that OPA3 dysregulation is context-dependent (Fig. 1A, Table S1). In pancreatic cancer samples (PAAD), OPA3 expression was higher in tumor tissues than in corresponding normal tissues (Fig. 1A). These data align with our previous immunohistochemistry analyses, which showed higher OPA3 protein levels in pancreatic cancer tissues than in their normal counterparts (3). OPA3 mRNA levels were higher in tumor tissues from 22 cancer types and lower in diffuse large B-cell lymphoma and testicular germ cell tumors, based on the reported differential expression threshold (P ≤ 0.05; Fig. 1A). There were no statistical differences in OPA3 mRNA levels between the remaining 7 cancer types and normal tissues (highlighted in grey, P>0.05).
Given the established role of KRAS mutations in pancreatic cancer (15), colon and rectal cancer (16), and lung cancer (17), we further examined whether OPA3 expression was associated with KRAS mutation status in these specific cancer types. OPA3 expression was not significantly different between KRAS-mutant and KRAS-wild-type pancreatic and lung tumors, while OPA3 expression was slightly increased in KRAS-mutant colon and rectal cancers (Fig. 1B). Furthermore, CCLE quantitative proteomic analysis showed no difference in OPA3 expression among pancreatic and colon cancer cell lines, whereas OPA3 protein levels were higher in KRAS-mutant lung cancer cells (Suppl. Fig.S1). TCGA analyses identified an association between KRAS pathway activity and OPA3 mRNA expression across the four cancer types (Suppl. Fig.S2). This association is compatible with a relationship between KRAS signaling and OPA3 expression but does not establish direct regulation by KRAS. Collectively, these analyses of public datasets indicate that OPA3 mRNA and protein expression are altered in diverse human cancers, exhibit limited concordance, and are largely independent of KRAS mutation status.
OPA3 gene knockout suppresses proliferation capacity preferentially in KRAS-mutant cancer cells
We have previously demonstrated that genetic knockdown of OPA3 impairs PANC-1 cell proliferation (3). To test whether OPA3 contributes to cancer cell growth across a broader panel of cell lines, we generated OPA3-knockout cell lines for pancreatic (PANC-1 and BxPC-3), lung (A549 and HCC827), and colon (HCT116) cancers with different KRAS genetic backgrounds (mutant and wild-type). Immunoblotting confirmed efficient depletion of OPA3 expression in two independent knockout clones for each cell line, while β-actin served as the loading control (Fig. 2A–E).
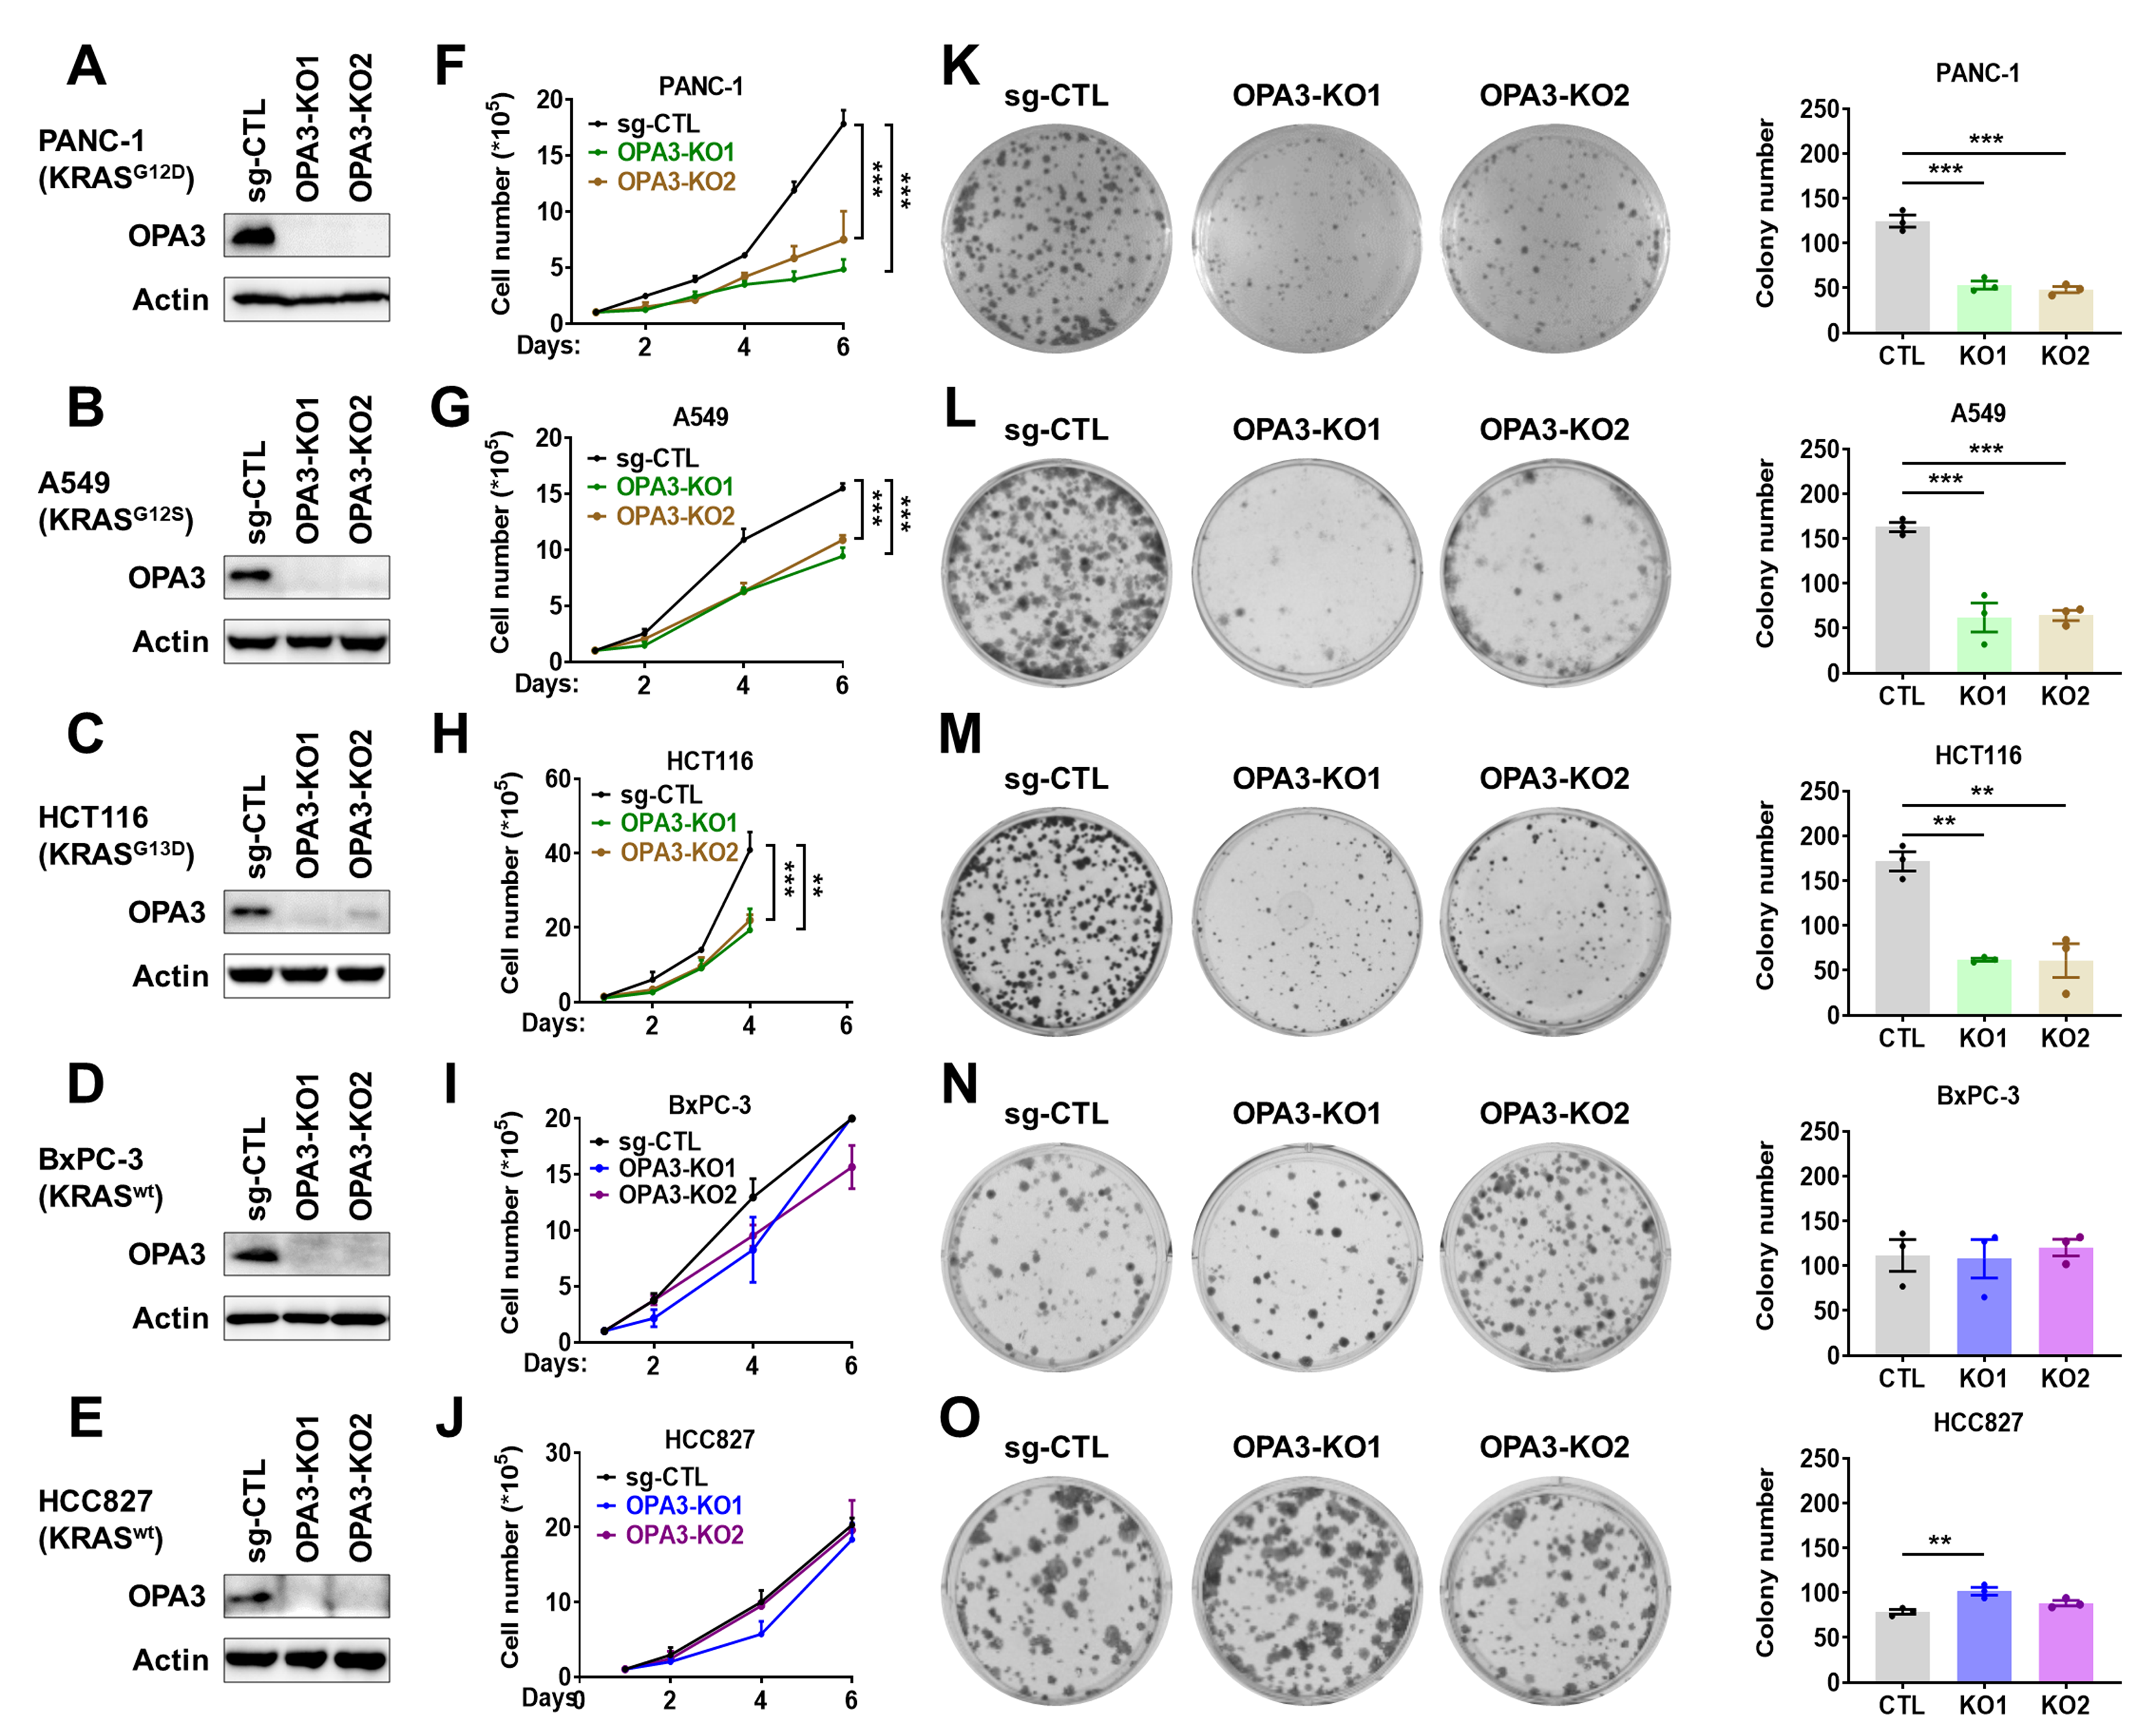
We first evaluated short-term cell proliferation by cell counting. In KRAS-mutant cancer cells, including PANC-1 (G12D), A549 (G12S), and HCT116 (G13D) cells, OPA3 knockout substantially reduced cell growth compared with control cells (Fig. 2F-H). In contrast, in BxPC-3 and HCC827 cells expressing wild-type KRAS, OPA3 knockout showed a proliferation rate similar to that of control cells (Fig. 2I-J). We next assessed long-term clonogenic survival using colony formation assays. Consistent with the short-term cell proliferation profiles, OPA3 depletion markedly impaired colony-forming ability in KRAS-mutant cancer cells (Fig. 2K-M), whereas OPA3 knockout had no inhibitory effect on clonogenic survival in KRAS-wild-type cancer cells (Fig. 2N-O). Within the cell-line panel examined, OPA3 depletion preferentially impaired proliferation and clonogenic growth in KRAS-mutant cells; whether KRAS mutation status independently determines this response remains unresolved.
OPA3 knockout impairs mitochondrial energy metabolism in PANC-1, but not in BxPC-3 cells
We previously demonstrated that OPA3 promotes tumor growth by increasing energy metabolism (3). We therefore compared mitochondrial metabolism in PANC-1 and BxPC-3 pancreatic cancer cells, which differ in KRAS status and in how OPA3 affects cell proliferation. We investigated whether OPA3 depletion altered mitochondrial function and cellular energy metabolism in PANC-1 cells. Seahorse mitochondrial stress assays were performed to measure oxygen consumption rate (OCR) in OPA3-knockout cells, and the loss of OPA3 caused a marked impairment of mitochondrial respiration. OPA3 knockout reduced the FCCP-stimulated oxygen consumption rate in PANC-1 cells, indicating impaired maximal mitochondrial respiratory capacity (Fig. 3A).
ECAR and MitoTracker Red measurements showed no consistent changes (Fig. 3B–C), whereas extracellular glucose and lactate measurements indicated altered metabolic activity in OPA3-knockout cells (Fig. 3D–E). ATP levels were approximately two-fold higher in PANC-1 control cells, suggesting that the observed metabolic changes did not compensate for reduced mitochondrial respiration. In contrast, most parameters remained unchanged in OPA3-KO BxPC-3 cells (Fig. 3G–J). Extracellular lactate levels decreased in both BxPC-3 knockout clones (Fig. 3K), whereas ATP levels increased in clone 1 (Fig. 3L). Together, these findings indicate that OPA3 knockout reduces ATP availability in PANC-1 cells, consistent with impaired proliferation, but does not produce a comparable ATP reduction in BxPC-3 cells.
OPA3 knockout suppresses PANC-1 and BxPC-3 in vivo tumor growth
To further determine the role of OPA3 in promoting tumor progression, we established subcutaneous xenograft models using these same OPA3-knockout PANC-1 and BxPC-3 cells. In the PANC-1 xenograft model, OPA3 knockout markedly suppressed tumor growth compared with control cells, as reflected by reduced tumor growth curves and decreased tumor weights (Fig. 4A–B).
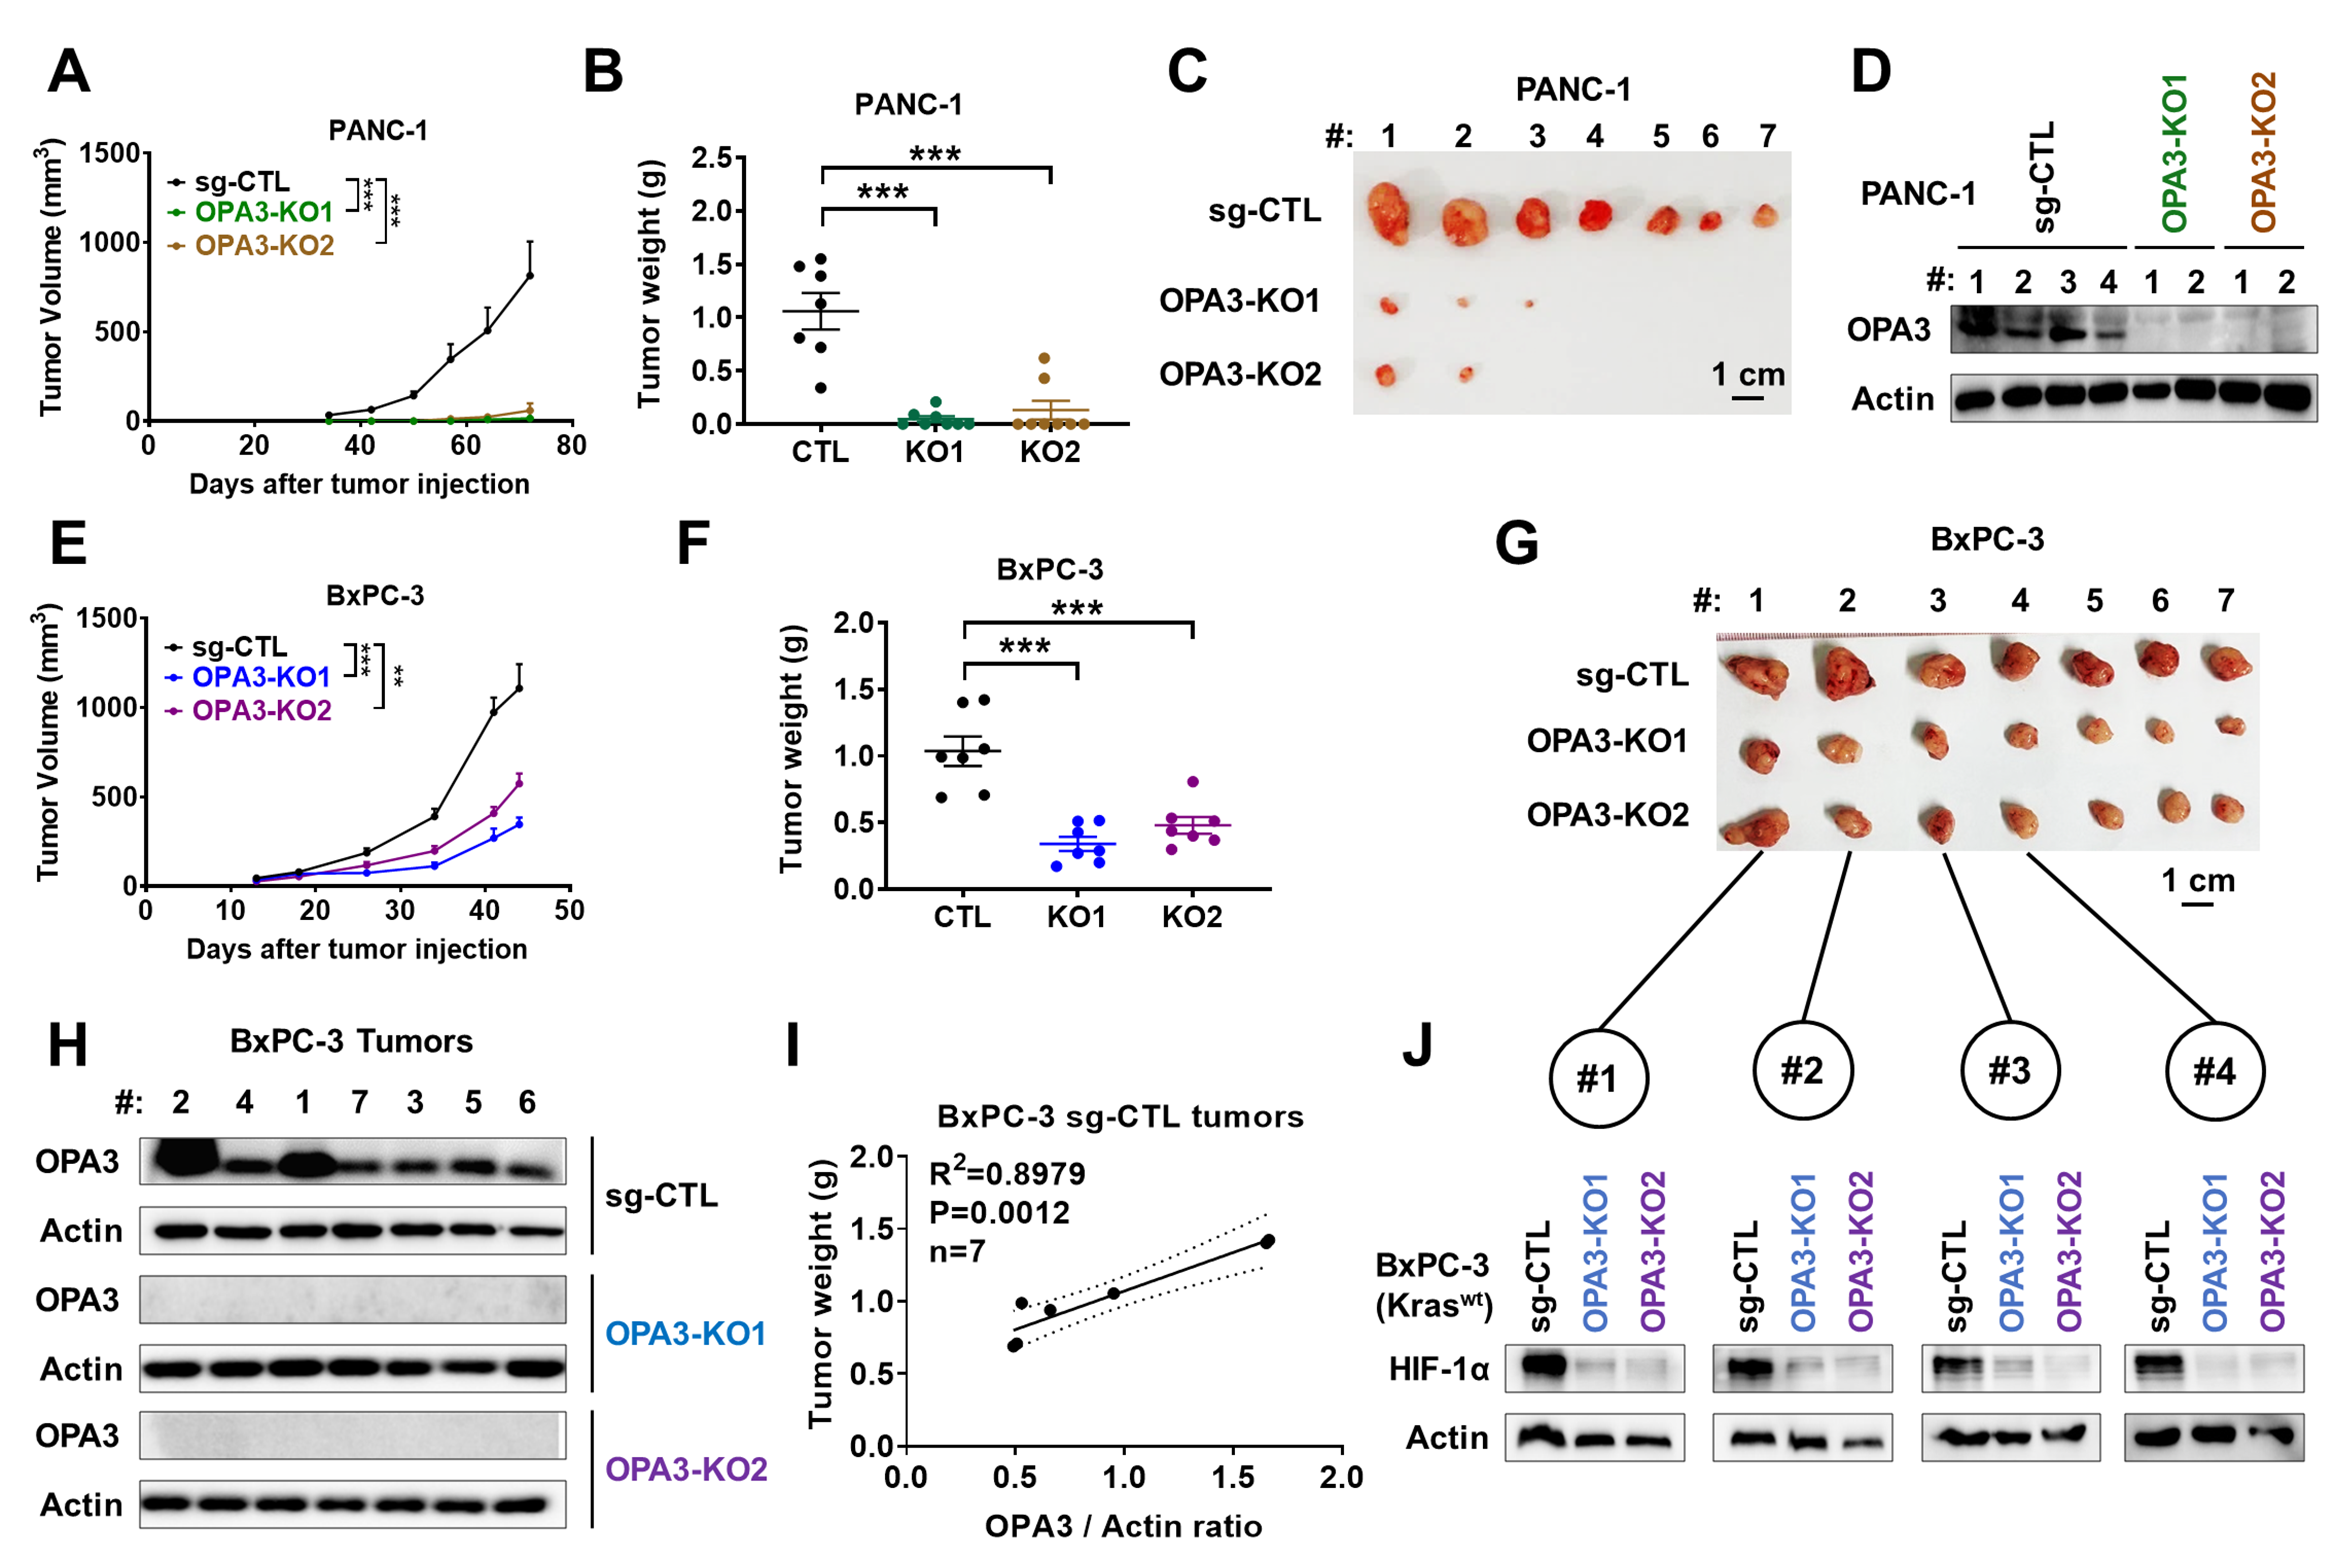
All seven control PANC-1 mice developed tumors, compared with 3 of 8 mice injected with OPA3-KO clone 1 and 2 of 8 injected with clone 2; the remaining 5 and 6 mice, respectively, remained tumor-free (Fig. 4C, Suppl. Fig.S3). These findings indicate impaired tumor establishment following OPA3 knockout. Immunoblotting confirmed OPA3 depletion in tumors arising from knockout cells (Fig. 4D). Given the differential effects of OPA3 depletion in KRAS-mutant and KRAS-wild-type cells in vitro, we examined BxPC-3 xenografts. OPA3 knockout reduced BxPC-3 tumor volumes and weights (Fig. 4E–G), with depletion confirmed by immunoblotting (Fig. 4H). OPA3 abundance positively correlated with control BxPC-3 tumor weights (Fig. 4I).
To explore the discrepancy between in vitro and in vivo findings, we examined hypoxia, a microenvironmental factor linked to metabolic reprogramming and therapeutic resistance (18). HIF-1α abundance was reduced in both BxPC-3 OPA3-KO tumor groups (Fig. 4J). Together, these findings indicate that OPA3 depletion suppresses pancreatic xenograft growth across different KRAS backgrounds, potentially involving hypoxia-related signaling.
OPA3 depletion reduces HIF-1α accumulation and impairs clonogenic growth under prolonged hypoxia
Because we observed decreased HIF-1α expression in OPA3-KO BxPC-3 tumors, we analyzed how OPA3 expression and hypoxia affect tumor cell proliferation and survival. After 8 h of exposure to normoxia (21% O₂) or hypoxia (1% O₂), OPA3 knockout did not appreciably alter HIF-1α protein abundance in BxPC-3 cells compared with the corresponding controls (Fig. 5A–B).
However, HIF-1α expression decreased in OPA3-KO BxPC-3 cells under hypoxia for 48 h (Fig. 5A-C), and they showed impaired growth under hypoxic conditions (Fig. 5D-E). We then analyzed HIF-1α expression in mutant KRAS-expressing cancer cells. Similar to BxPC-3 cells, HIF-1α expression decreased in OPA3-KO mutant KRAS cells under hypoxia for 48 h (Fig. 5F-G). These results implicate OPA3 in maintaining HIF-1α protein accumulation during prolonged hypoxia, although the underlying mechanism and its contribution to tumor growth remain to be established.
Consistent with an association between OPA3 and hypoxia-related signaling, analysis of TCGA datasets revealed positive correlations between OPA3 mRNA expression and hypoxia pathway activity in pancreatic adenocarcinoma, lung adenocarcinoma, colon adenocarcinoma, and rectal adenocarcinoma (Suppl. Fig. S4). These transcriptomic associations are observational and do not establish a causal role for OPA3 in regulating hypoxic responses.
Spatial transcriptomic analysis links OPA3 expression to HIF1A expression in pancreatic cancer tissues
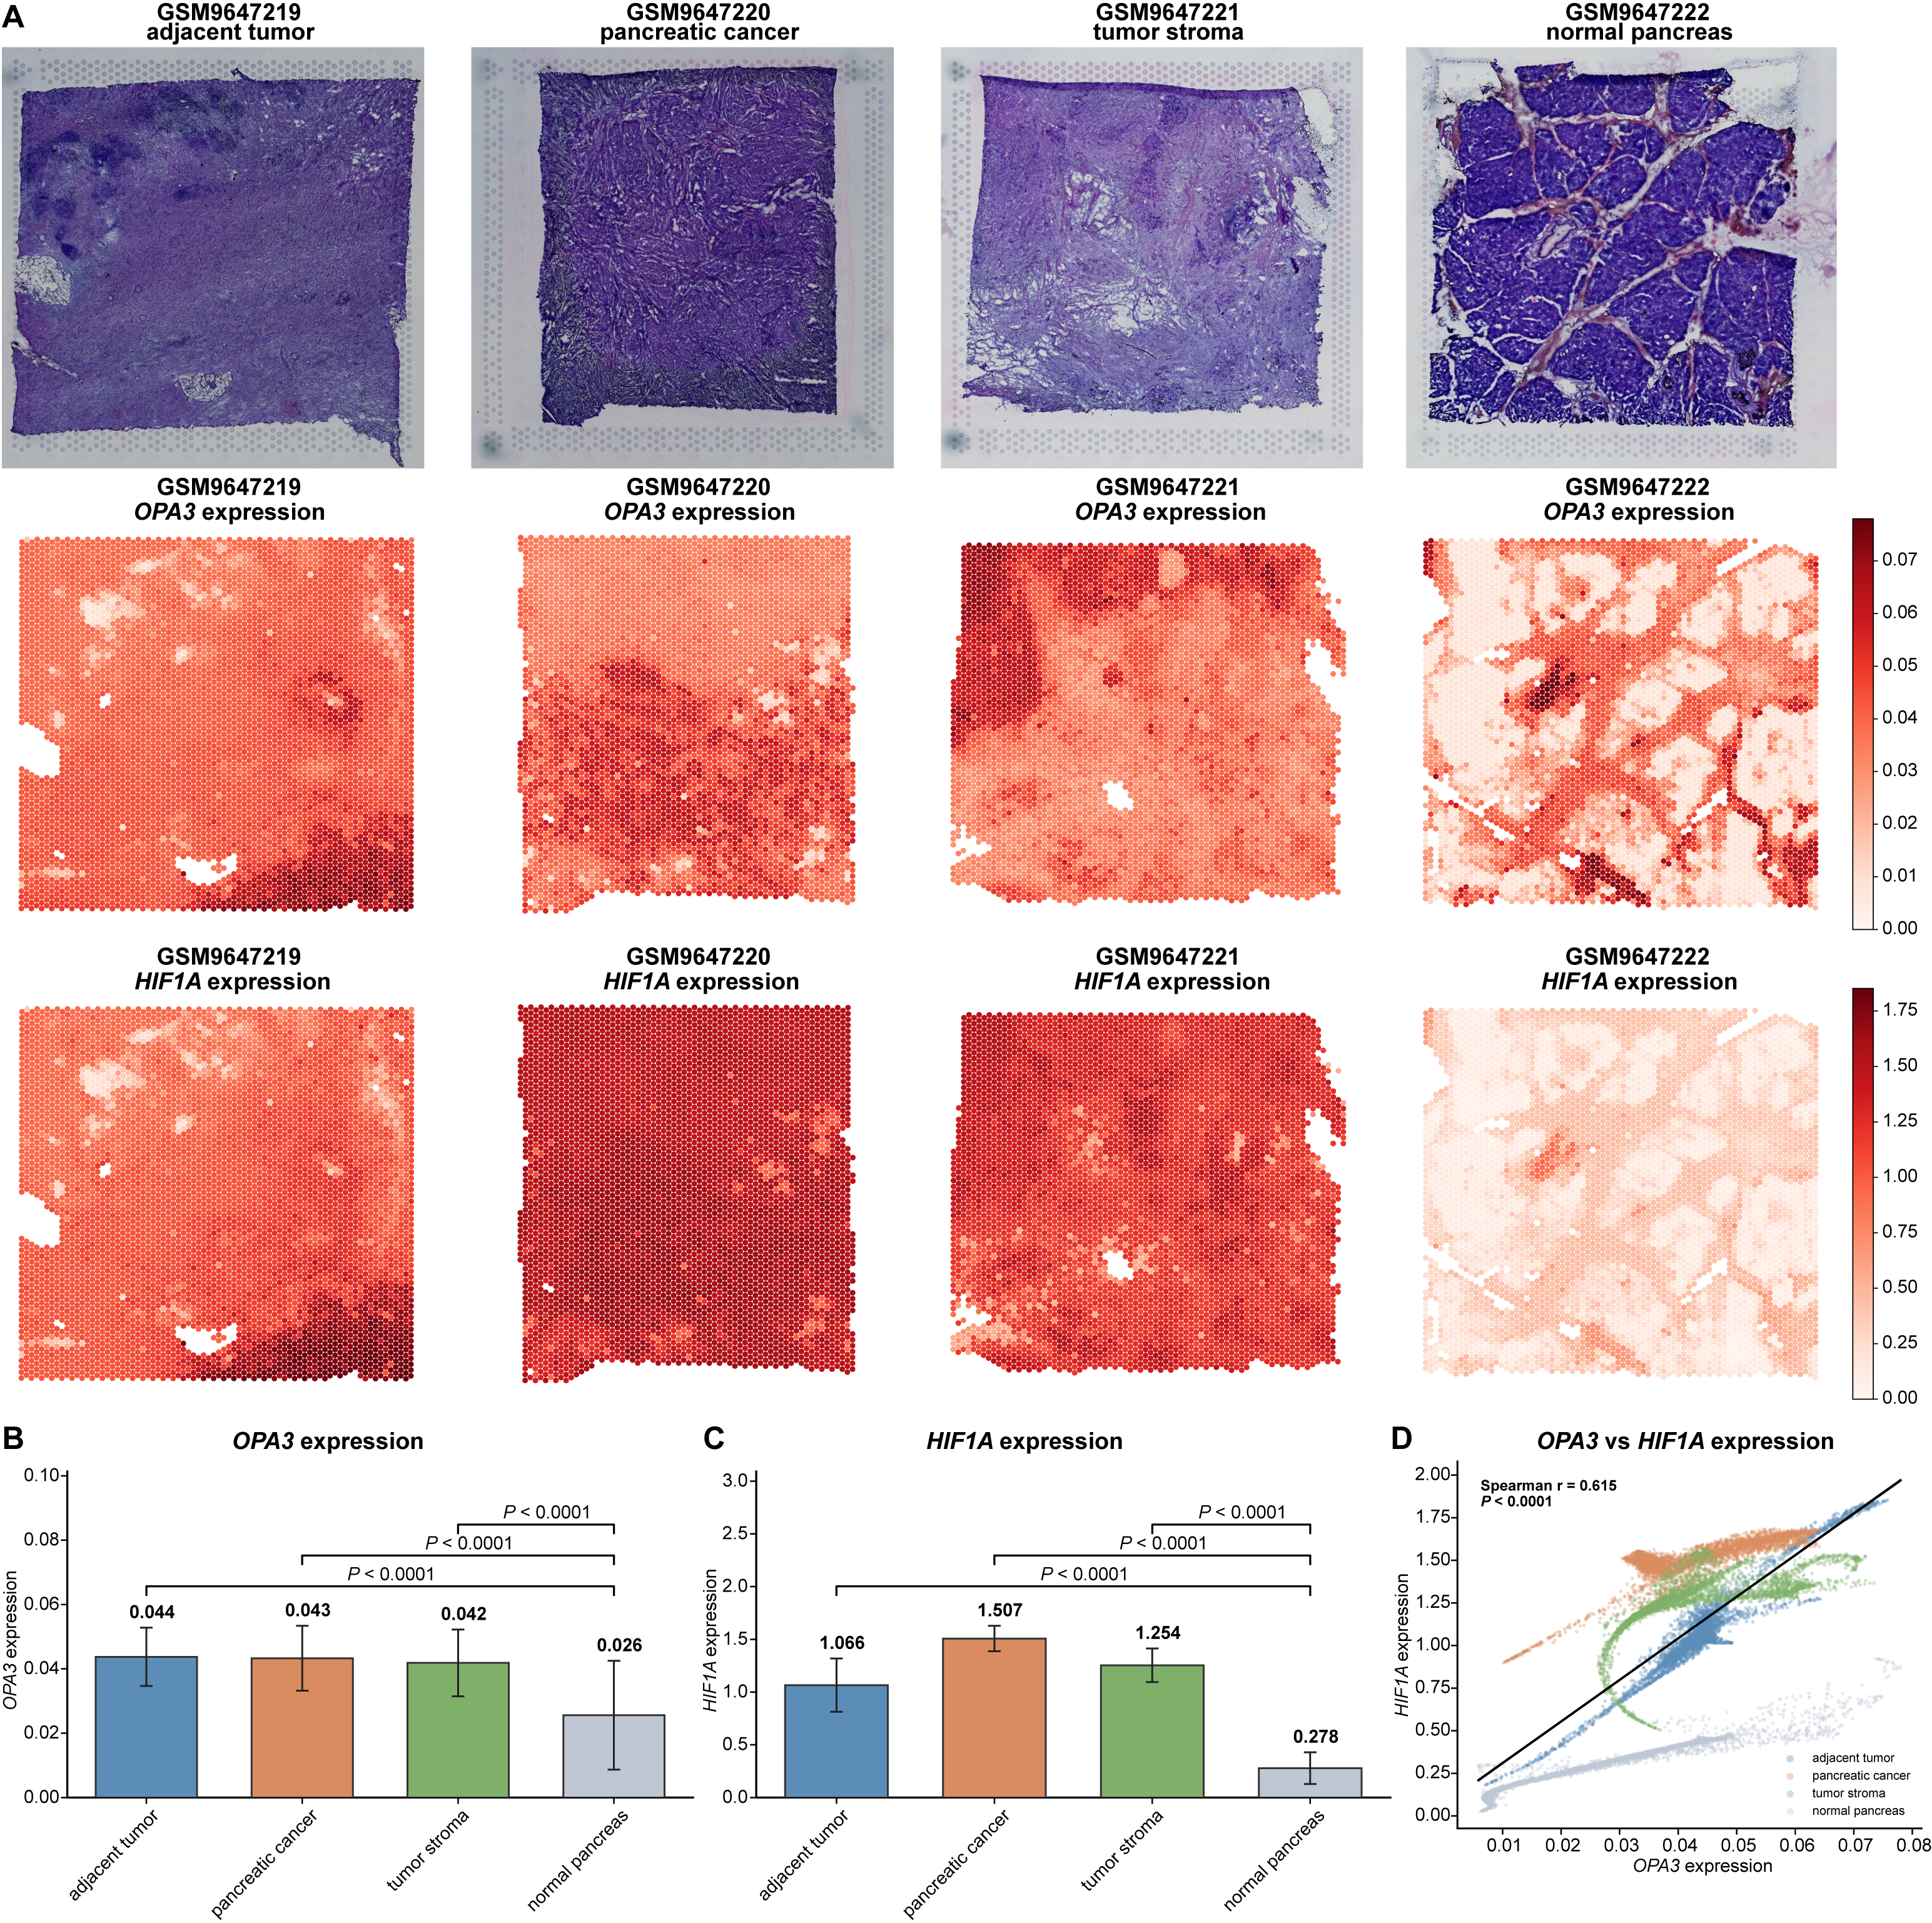
Given that OPA3 depletion reduced HIF-1α accumulation under prolonged hypoxia, we next investigated whether OPA3 and HIF1A expression were spatially associated in human pancreatic tissues. To address this question, we analyzed spatial transcriptomic profiles from four pancreatic tissue sections representing adjacent tumor tissue, pancreatic cancer, tumor-associated stroma, and normal pancreas. Hematoxylin and eosin staining confirmed the distinct histological features of these tissue regions, and spatial expression mapping showed that both OPA3 and HIF1A signals were broadly enriched in tumor-associated sections compared with normal pancreas (Fig. 6A).
Exploratory spot-level analysis showed higher OPA3 expression in adjacent tumor tissue, pancreatic cancer, and tumor-associated stroma than in normal pancreas, with mean expression values of 0.044, 0.043, and 0.042, respectively, compared with 0.026 in normal pancreas (spot-level comparisons, all P < 0.0001; Fig. 6B). These comparisons describe differences among the analyzed tissue sections and do not establish statistical significance across independent biological specimens. A similar pattern was observed for HIF1A expression, which was markedly increased in pancreatic cancer and tumor-associated stroma, and remained higher in adjacent tumor tissue than in normal pancreas. Mean HIF1A expression values were 1.066 in adjacent tumor tissue, 1.507 in pancreatic cancer, and 1.254 in tumor-associated stroma, compared with 0.278 in normal pancreas (exploratory spot-level comparisons, all nominal P < 0.0001; Fig. 6C). These comparisons do not establish differences across independent biological specimens. Exploratory spot-level analysis identified a positive association between OPA3 and HIF1A expression across the four analyzed tissue sections (Spearman r = 0.615, nominal P < 0.0001; Fig. 6D). Because individual capture spots are not independent biological replicates, this association should not be interpreted as evidence of reproducibility across independent patients. Notably, pancreatic cancer and tumor-associated stroma regions displayed relatively high HIF1A expression in areas with elevated OPA3 expression, whereas normal pancreas showed low expression of both genes. Together, these spatial transcriptomic data complement our functional findings by showing that OPA3 expression is positively associated with HIF1A expression in human pancreatic tumor-associated tissues. The spatial association between OPA3 and HIF1A provides descriptive human-tissue context but cannot establish direct molecular regulation or causality.
3. Discussion
Recent studies have demonstrated altered OPA3 expression in various cancer types, including pancreatic cancer, ovarian cancer, colorectal cancer, and squamous cell carcinoma (3, 7-9). Our bioinformatics analyses showed that 22 of 31 cancer types exhibited higher OPA3 mRNA levels in tumors than in their corresponding normal tissues. However, these data should be interpreted cautiously because OPA3 mRNA and protein levels may not correlate. In that context, we cannot rule out environmental factors, including the HIF-1α transcription factor, influencing OPA3 expression in tumor cells and surrounding tissues. The mechanisms of OPA3 gene regulation are largely unknown and deserve further investigation.
Although several studies support a tumor-promoting role for OPA3, Wu and Liu reported that OPA3 overexpression inhibited colorectal cancer cell proliferation and increased sensitivity to bevacizumab (10), contrasting with findings from another colorectal cancer model (9). Differences in cell-line background and experimental conditions may contribute to these divergent results, supporting a context-dependent role for OPA3 in cancer. A key finding is the difference between in vitro and in vivo responses to OPA3 depletion. OPA3 knockout preferentially impaired proliferation and clonogenic growth in the three KRAS-mutant cell lines examined, whereas the two KRAS-wild-type lines showed limited in vitro growth inhibition. However, these models differ in tissue origin and other molecular characteristics, preventing attribution of the observed responses exclusively to KRAS mutation status. Notably, OPA3 knockout suppressed tumor growth in both KRAS-mutant PANC-1 and KRAS-wild-type BxPC-3 xenografts, suggesting that OPA3 dependence may also depend on conditions not reproduced in conventional cell culture. Isogenic KRAS models, OPA3 re-expression experiments, and analyses of tumor-associated metabolic and microenvironmental factors will be needed to define the mechanisms underlying these context-dependent effects.
OPA3 depletion reduced HIF-1α protein accumulation after prolonged hypoxia, but the mechanism remains unresolved. HIF signaling regulates metabolic adaptation, angiogenesis, and other processes involved in cancer progression, with effects that vary according to tumor type and microenvironmental conditions (21). Because HIF-1α abundance depends on oxygen-sensitive degradation and additional regulatory mechanisms, the present findings do not establish direct protein stabilization by OPA3 (22). The absence of a comparable effect after short-term hypoxia further suggests that the relationship may depend on the duration of oxygen deprivation. Protein-turnover assays, measurements of HIF-1α hydroxylation and transcriptional activity, and genetic rescue experiments would help distinguish direct regulation from secondary metabolic effects. Hypoxia also modifies immune-cell function, stromal interactions, angiogenesis, and extracellular acidity (19), while hypoxia-associated extracellular matrix remodeling can facilitate tumor invasion (23). Whether OPA3 influences these processes remains unknown. The present xenograft models cannot determine whether OPA3 depletion alters antitumor immunity or stromal responses, both of which may influence therapeutic outcomes (24, 25). Moreover, metabolic reprogramming may have broader consequences for tumor–microenvironment interactions, although such effects have not been established for OPA3 (26).
The spatial transcriptomic findings provide a complementary but preliminary connection to human pancreatic cancer. The analysis includes four tissue sections, and the large number of capture spots does not compensate for the limited number of independent biological specimens. Differences in cellular composition across tumor, stromal, adjacent, and normal regions may contribute to the observed expression patterns. Moreover, computational imputation can influence apparent gene–gene relationships, making validation with un-imputed data particularly important. Because HIF1A transcript abundance does not necessarily reflect HIF-1α protein stabilization, spatial co-expression should not be interpreted as direct evidence of hypoxic pathway activation. Validation in independent patient cohorts, analysis of non-imputed expression data, spatial assessment of HIF-1α protein and hypoxia markers, and functional perturbation studies are needed before these associations can be interpreted as evidence of an OPA3-dependent hypoxic response in human pancreatic tumors.
The distinction between metabolic vulnerability and hypoxic adaptation may have therapeutic implications. OPA3 depletion could affect tumor-cell fitness differently depending on oncogenic background, oxygen availability, and metabolic state. However, genetic knockout does not establish that pharmacological inhibition would reproduce these effects, and no selective OPA3 inhibitor was evaluated. The findings therefore support further investigation of OPA3-associated metabolic and hypoxic dependencies rather than establishing OPA3 as a clinically actionable target.
No selective OPA3 inhibitor has been established. In ovarian cancer models with elevated OPA3 expression, the BET inhibitor PFI-1 and NUAK inhibitor WZ4003 exhibited antitumor activity in a drug-screening analysis (7), but these observations do not demonstrate direct OPA3 inhibition. Separately, doxorubicin-associated changes in OPA3 expression have been reported in a non-malignant cardiac cell model (20), limiting their relevance to cancer therapy. Whether pharmacological modulation of OPA3 can reproduce the effects of genetic depletion or alter hypoxia-associated tumor growth remains to be determined.
4. Materials and Methods
Cell culture
Human PANC-1 pancreatic cancer cells with KRASG12D mutation (#CRL-1469), A549 lung cancer cells with KRASG12S mutation (#CRM-CCL-185), HCT116 colon cancer cells with KRASG13D mutation (#CCL-247), BxPC-3 pancreatic cancer cells with wild-type KRAS (#CRL-1687), HCC827 lung cancer cells with wild-type KRAS (#CRL-2868), and human embryonic kidney cells (HEK) 293T cells (#CRL-3216) were purchased from the American Type Culture Collection (ATCC, Manassas, VA, USA). Cells were cultured in RPMI (Roswell Park Memorial Institute; for BxPC-3 and HCC827), DMEM (Dulbecco’s modified Eagle’s medium; for PANC-1 and 293T), F12K (Kaighn's Modification of Ham's F-12 medium; for A549), or McCoy’s 5A medium (for HCT116) supplemented with 10% fetal bovine serum (FBS). All culture media were from Gibco (Grand Island, NY, USA). The absence of mycoplasma in the culture media of all cell lines was confirmed using the LookOut mycoplasma PCR detection kit (Sigma-Aldrich, Saint Louis, MO, USA; #MP0035). Cell line authentication was performed by short tandem repeat (STR) genotyping (Microread Genetics, Beijing, China). Hypoxia was induced using the Anoxomat Mark II anaerobic culture system (Mart Microbiology B.V., Lichtenvoorde, Netherlands) with a gas mixture of 1% O2, 5% CO2, and 94% N2. The chamber was purged with the gas mixture to establish the desired atmosphere. Finally, the chamber was incubated at 37 °C for the indicated times.
Generation of OPA3-knockout cancer cell lines
In order to generate lentiviruses, 293T cells (density: 1 million cells per flask in 5 mL medium) were cultured in T-25 flasks for 48 h. 293T cells were transfected using X-tremeGENE HP transfection reagent (Merck, Darmstadt, Germany; #6366244001) according to the manufacturer’s protocol with 2.8 μg of psPAX2 plasmid (Addgene, Watertown, MA, USA; #12260), 1.6 μg of pMD2.G vector (Addgene, #12259) and 2 μg of target plasmid. Two lentiviral sgRNA plasmids targeting human OPA3 were obtained from Genecopoeia (Rockville, MD, USA) and constructed in the pCRISPR-LvSG06 vector. The sgRNA target sequences were as follows: sgOPA3-1, 5’-GGTGGTGGGCGCGTTCCCTA-3’ (Exon 1); and sgOPA3-2, 5’-GCTATACTTGGGCATCCGGC-3’ (Exon 1). The negative control lentiviral plasmid EX-NEG-Lv105 (Genecopoeia) was used as the control. After 72 h, the culture medium containing viruses was collected, centrifuged for 10 min at 3000 rpm at 4 °C, and passed through a 0.45 µm filter. Cancer cells were seeded in 6-well plates (1× 10⁵ cells per well in 2 mL medium) for 24 h, then infected with viruses and 8 µg/mL of polybrene (Sigma-Aldrich; #TR-1003-G) containing medium. Culture medium was removed 72 h after infection, and cells were selected in the presence of 1 μg/mL puromycin (Invivogen, San Diego, CA, USA; #ant-pr-1), until clonal populations were obtained. Clones were obtained by serial dilution and OPA3 expression was detected by immunoblotting.
Cell proliferation assays
For the cell growth assay, 1×10⁵ cells were seeded in 6-well plates and counted every 24 h with an automated cell counter (Cellometer Auto T4; Nexcelom Bioscience, Lawrence, MA, USA). Clonogenic assays were performed by seeding cells in 6-well plates (500 cells in 2 mL medium per well) at single cell density. Cells were allowed to grow for 14 days. Culture medium was then discarded, and colonies were fixed with 1 mL methanol for 10 min, and then stained with crystal violet (Sigma-Aldrich, St. Louis, MO, USA; #V5265) to determine clonogenic survival.
Measurement of oxygen consumption rate (OCR) and extracellular acidification rate (ECAR)
To estimate the rate of glycolysis and mitochondrial respiration, Seahorse XFe/XF Analyzer (Agilent, Santa Clara, CA, USA) was used according to the manufacturer’s protocol. Briefly, 4×10⁴ cells per well were seeded in culture medium, and the sensor cartridge was hydrated in Seahorse XF Calibrant buffer (#100840-000) at 37 °C in an incubator without CO2 for 24 h. Then, the culture medium was removed and replaced with Seahorse assay medium. For the mitochondrial respiration test, the medium (pH 7.4) contained 1 mM pyruvate, 2 mM glutamine, and 10 mM glucose. The Mito Stress assay (#103015-100) was performed by sequentially injecting 1 μM oligomycin, 1 μM carbonyl cyanide p-trifluoromethoxyphenylhydrazone (FCCP), and 0.5 μM rotenone/0.5 μM antimycin A. Cell number adjustment and normalization were performed using a bicinchoninic acid (BCA) assay (Thermo Scientific, Waltham, MA, USA; #23227).
Measurement of mitochondrial function
Mitochondrial function was assessed using MitoTracker Red CMXRos dye (ThermoFisher Scientific, Waltham, MA, USA, #M7512) according to the manufacturer’s instructions. Briefly, 5×10⁴ control and OPA3-knockout cells were seeded in 6-well plates for 48 h and collected. Cells were then washed with phosphate-buffered saline (PBS), and incubated with 100 nM MitoTracker Red working solution diluted in pre-warmed complete culture medium at 37 °C in the dark for 30 min. After staining, cells were washed with PBS to remove excess dye and resuspended in PBS for flow cytometry analysis. Fluorescence intensity was quantified by flow cytometry. The mean fluorescence intensity (MFI) of MitoTracker Red was calculated for each sample and normalized to the corresponding control group as an indicator of mitochondrial membrane-potential-associated dye accumulation. To measure ATP levels, cells (1×10⁴ per well) were seeded in black 96-well plates, and the ATP content was assessed using the bioluminescence CellTiter-Glo viability assay kit (Promega, Madison, WI, USA; #G7570) according to the procedure provided by the manufacturer. Results are expressed as a percentage of the ATP levels in control (sg-CTL) cells. To measure glucose and lactate concentrations, 1×10⁵ cells were seeded in 6-well plates for 48 h. The concentrations of lactate and glucose were measured in the culture medium using an SBA-90 Biosensor Analyzer (Biology Institute of Shandong Academy of Sciences, Jinan, China).
Immunoblotting
Cells harvested from 6-well plates or tumor samples (50-100 mg) were lysed in sodium dodecyl sulfate (SDS) lysis buffer (10 mM Tris‐HCl, pH 6.8, 5% SDS, 10 mM EDTA, 50 mM NaCl). Tumor samples were then disrupted with a tissue homogenizer (Precellys, Bertin Instruments, Montigny-le-Bretonneux, France) and centrifuged at 12,000 rpm at 4 ºC for 10 min. Protein concentrations were measured using the BCA assay (Thermo Scientific). Primary antibodies used for immunoblotting included: OPA3 (Proteintech, Rosemont, IL, USA; #15638-1-AP), HIF-1α (Cell Signaling Technology, Beverly, MA, USA; #36169), and β-actin (Cell Signaling Technology; #8457S). Secondary antibodies were anti-rabbit IgG (#7074S) from Cell Signaling Technology. Protein bands were visualized using an enhanced chemiluminescence (ECL) detection reagent (Clarity Max Western ECL substrate, Bio-Rad; #1705062). When appropriate, Western blot bands were quantified using the ImageJ software (http://rsb.info.nih.gov/ij/). Protein expression was normalized to β-actin of the corresponding samples.
Animal experiments
Seven-week-old female nude BALB/c mice (Vital River Laboratory Animal Technology, Beijing, China) were housed in a controlled environment with ad libitum access to food and water. Upon delivery, mice underwent a one-week acclimation period. At the beginning of each experiment, mice were randomly assigned to groups to ensure similar body weight between groups. Human PANC-1 pancreatic cancer cells (1×10⁶ cells in 100 µL PBS) or BxPC-3 cancer cells (1×10⁶ cells in 100 µL PBS) were injected into the right flank of mice. Tumor volumes were measured twice per week and calculated using a modified ellipsoid formula: tumor volume (mm3) = [length (mm) x width2 (mm)]/2. Tumor establishment was assessed in all injected mice and defined by the development of a measurable tumor. Mice without measurable tumors were classified as tumor-free and retained as experimental subjects when reporting tumor-establishment outcomes. All mice in the PANC-1 experimental groups (n=7 for control, and n=8 for each OPA3-KO clone) were included in the tumor-volume and endpoint tumor-weight analyses. Mice without measurable tumors were assigned zero tumor volume at the corresponding measurement time points and zero endpoint tumor weight. These mice were retained in all group-level analyses. The animal experiments were performed in an unblinded manner. If animals presented ulcerated tumors, tumor length ≥ 20 mm, or tumor volume ≥ 1500 mm3, they were euthanized to minimize distress and suffering. All animal experiments were conducted in accordance with the institutional guidelines and approved by the Animal Care and Use Committee of Sun Yat-Sen University Cancer Center (Approval number: L102012020030M).
Bioinformatics
Public transcriptomic, proteomic, and spatial transcriptomic datasets were analyzed to evaluate OPA3 expression, its association with KRAS mutation status, and its relationship with KRAS signaling and hypoxia programs. A detailed description of bioinformatic analyses is provided in the Supplementary Materials.
For the pan-cancer analysis, OPA3 mRNA expression across tumor and normal tissues was assessed using the differential expression module of GEPIA (11), which integrates RNA-seq data from The Cancer Genome Atlas (TCGA) and the Genotype-Tissue Expression (GTEx) Project. Expression values were based on log2(TPM+1)-transformed data, and cancer types were ranked according to tumor-normal expression differences. Associations between OPA3 expression and KRAS mutation status were evaluated in TCGA cohorts of Pancreatic Adenocarcinoma (PAAD), Lung Adenocarcinoma (LUAD), Colon Adenocarcinoma (COAD), and Rectum Adenocarcinoma (READ). Tumors carrying non-synonymous KRAS mutations were classified as KRAS-mutant and those without KRAS mutations as KRAS-wild-type.
For proteomic validation, OPA3 protein abundance data from the Cancer Cell Line Encyclopedia (12) were integrated with lineage annotations and KRAS mutation status for pancreatic, colorectal, and lung cancer cell lines. KRAS and hypoxia pathway activities were quantified using the Hallmark gene sets HALLMARK_KRAS_SIGNALING_UP and HALLMARK_HYPOXIA by single-sample gene set enrichment analysis of log2(TPM+1)-transformed expression data.
Spatial transcriptomic analysis was performed in Python using four publicly available 10x Genomics Visium pancreatic datasets: adjacent tumor tissue (GSM9647219), pancreatic cancer (GSM9647220), tumor stroma (GSM9647221), and normal pancreas (GSM9647222). Data were processed in Scanpy using normalization and log1p transformation (13), followed by MAGIC imputation (k=5, decay=1, automatic diffusion time, exact solver) (14). MAGIC-imputed OPA3 and HIF1A expression values were used to generate spatial expression maps and to compare expression across tissue types and assess spot-level OPA3-HIF1A associations.
Statistical analyses
All in vitro experiments were performed at least three times (three independent repeats), unless otherwise specified. Q-Q plots were used to compare and determine data distribution. Data are expressed as mean ± S.E.M. (standard error of the mean), unless otherwise specified. When there were more than two independent groups, ANOVA was used to compare the means if a normal distribution could be assumed. Dunnett post hoc tests (for comparisons with control groups) were performed when ANOVA was significant. When groups under different experimental conditions were compared (such as normoxia and hypoxia), a two-way ANOVA test was used. When the standard deviation increased with the mean, as with tumor volumes (in vivo animal studies), data were log10-transformed before statistical analysis. While zero values were retained as experimental observations, the log10-transformed tumor volume data were analyzed using a generalized linear model. Post-hoc comparisons of groups two-by-two were performed using a Bonferroni correction for P-values. The relationship between OPA3 expression and other parameters (tumor weight, HIF-1α activity, etc.) was assessed using Spearman’s rank correlation. For bioinformatic analyses, Wilcoxon rank-sum tests were used for two-group comparisons in TCGA and CCLE datasets. Dunn’s test with Holm correction was used for multiple spot-level comparisons in Visium data. Statistical analyses were performed with GraphPad Prism (San Diego, CA, USA) and SPSS 16.0 (Chicago, IL, USA) software. No statistical method was used to calculate sample sizes, which were determined empirically. No data were excluded. All tests were two-tailed, and a P-value of 0.05 or less was considered statistically significant.
References
1. Faubert B, Solmonson A, DeBerardinis RJ. Metabolic reprogramming and cancer progression. Science. 2020;368(6487):eaaw5473. https://doi.org/10.1126/science.aaw5473
2. Hanahan D. Hallmarks of cancer: new dimensions. Cancer Discov. 2022;12(1):31–46. https://doi.org/10.1158/2159-8290.CD-21-1059
3. Meng N, Glorieux C, Zhang Y, Liang L, Zeng P, Lu W, et al. Oncogenic K-ras induces mitochondrial OPA3 expression to promote energy metabolism in pancreatic cancer cells. Cancers (Basel). 2019;12(1):65. https://doi.org/10.3390/cancers12010065
4. Anikster Y, Kleta R, Shaag A, Gahl WA, Elpeleg O. Type III 3-methylglutaconic aciduria (optic atrophy plus syndrome, or Costeff optic atrophy syndrome): identification of the OPA3 gene and its founder mutation in Iraqi Jews. Am J Hum Genet. 2001;69(6):1218–1224. https://doi.org/10.1086/324651
5. Huizing M, Dorward H, Ly L, Klootwijk E, Kleta R, Skovby F, et al. OPA3, mutated in 3-methylglutaconic aciduria type III, encodes two transcripts targeted primarily to mitochondria. Mol Genet Metab. 2010;100(2):149–154. https://doi.org/10.1016/j.ymgme.2010.03.005
6. Ryu SW, Jeong HJ, Choi M, Karbowski M, Choi C. Optic atrophy 3 as a protein of the mitochondrial outer membrane induces mitochondrial fragmentation. Cell Mol Life Sci. 2010;67(16):2839–2850. https://doi.org/10.1007/s00018-010-0365-z
7. Tsai HW, Li CJ, Lin LT, Chiang AJ, Chen SN, Wen ZH, et al. Expression status and prognostic significance of mitochondrial dynamics OPA3 in human ovarian cancer. Aging (Albany NY). 2022;14(9):3874–3886. https://doi.org/10.18632/aging.204050
8. Yang Z, Zhang Y, Wang X, Huang J, Guo W, Wei P, et al. Putative biomarkers of malignant transformation of sinonasal inverted papilloma into squamous cell carcinoma. J Int Med Res. 2019;47(6):2371–2380. https://doi.org/10.1177/0300060519838385
9. Yin Y, Ma Z, Yuan S, Xu K, Wang X. OPA3 inhibits the cGAS-STING pathway mediated by mtDNA stress to promote colorectal cancer progression. In Vitro Cell Dev Biol Anim. 2025;61(2):165–177. https://doi.org/10.1007/s11626-024-01000-3
10. Wu H, Liu D. OPA3 overexpression modulates lipid droplet production and sensitizes colorectal cancer cells to bevacizumab treatment. Biocell. 2024;48(6):971–980. https://doi.org/10.32604/biocell.2024.049466
11. Kang YJ, Pan L, Liu Y, Rong Z, Liu J, Liu F. GEPIA3: Enhanced drug sensitivity and interaction network analysis for cancer research. Nucleic Acids Res. 2025;53(W1):W283–W290. https://doi.org/10.1093/nar/gkaf423
12. Nusinow DP, Szpyt J, Ghandi M, Rose CM, McDonald ER 3rd, Kalocsay M, et al. Quantitative proteomics of the cancer cell line encyclopedia. Cell. 2020;180(2):387–402.e16. https://doi.org/10.1016/j.cell.2019.12.023
13. Wolf FA, Angerer P, Theis FJ. SCANPY: large-scale single-cell gene expression data analysis. Genome Biol. 2018;19(1):15. https://doi.org/10.1186/s13059-017-1382-0
14. van Dijk D, Sharma R, Nainys J, Yim K, Kathail P, Carr AJ, et al. Recovering gene interactions from single-cell data using data diffusion. Cell. 2018;174(3):716–729.e27. https://doi.org/10.1016/j.cell.2018.05.061
15. Bardeesy N, DePinho RA. Pancreatic cancer biology and genetics. Nat Rev Cancer. 2002;2(12):897–909. https://doi.org/10.1038/nrc949
16. Cancer Genome Atlas Network. Comprehensive molecular characterization of human colon and rectal cancer. Nature. 2012;487(7407):330–337. https://doi.org/10.1038/nature11252
17. Herbst RS, Heymach JV, Lippman SM. Lung cancer. N Engl J Med. 2008;359(13):1367–1380. https://doi.org/10.1056/NEJMra0802714
18. Suvac A, Ashton J, Bristow RG. Tumour hypoxia in driving genomic instability and tumour evolution. Nat Rev Cancer. 2025;25(3):167–188. https://doi.org/10.1038/s41568-024-00781-9
19. Jing X, Yang F, Shao C, Wei K, Xie M, Shen H, et al. Role of hypoxia in cancer therapy by regulating the tumor microenvironment. Mol Cancer. 2019;18(1):157. https://doi.org/10.1186/s12943-019-1089-9
20. Wang Y, Ying X, Wang Y, Zou Z, Yuan A, Xiao Z, et al. Hydrogen sulfide alleviates mitochondrial damage and ferroptosis by regulating OPA3-NFS1 axis in doxorubicin-induced cardiotoxicity. Cell Signal. 2023;107:110655. https://doi.org/10.1016/j.cellsig.2023.110655
21. Schito L, Semenza GL. Hypoxia-inducible factors: master regulators of cancer progression. Trends Cancer. 2016;2(12):758–770. https://doi.org/10.1016/j.trecan.2016.10.016
22. Semenza GL. Hypoxia-inducible factors in physiology and medicine. Cell. 2012;148(3):399–408. https://doi.org/10.1016/j.cell.2012.01.021
23. Gilkes DM, Semenza GL, Wirtz D. Hypoxia and the extracellular matrix: drivers of tumour metastasis. Nat Rev Cancer. 2014;14(6):430–439. https://doi.org/10.1038/nrc3726
24. Binnewies M, Roberts EW, Kersten K, Chan V, Fearon DF, Merad M, et al. Understanding the tumor immune microenvironment (TIME) for effective therapy. Nat Med. 2018;24(5):541–550. https://doi.org/10.1038/s41591-018-0014-x
25. Xu M, Zhang T, Xia R, Wei Y, Wei X. Targeting the tumor stroma for cancer therapy. Mol Cancer. 2022;21(1):208. https://doi.org/10.1186/s12943-022-01670-1
26. Sun L, Zhang H, Gao P. Metabolic reprogramming and epigenetic modifications on the path to cancer. Protein Cell. 2022;13(12):877–919. https://doi.org/10.1007/s13238-021-00846-7
Declarations
Funding Statement
This project has received funding from the Research Council of Lithuania (LMTLT) and the Ministry of Education, Science and Sport of the Republic of Lithuania (Grant number: S-A-UEI-23-7).
Competing Interest
The authors declare no financial or personal relationships with other individuals or organizations that could inappropriately influence or bias the content of this work. All authors have read the final version of the manuscript and confirm that there are no competing interests.
Consent for Publication
Consent for publication: All authors have approved the final version of the manuscript.
Use of Artificial Intelligence Disclosure
This article was written by human contributors. Artificial intelligence (AI)-based tools were used solely to improve grammar, language, and readability without altering the scientific content, data interpretation, or conclusions. The authors reviewed and verified the final manuscript and take full responsibility for its accuracy and integrity.
Data Availability Statement
All bioinformatics datasets (GEPIA, TCGA, CCLE, and 10x Genomics Visium spatial transcriptomics) analyzed in this study are publicly available, as indicated in the Methods section. All raw data generated in this study have been deposited in the Research Data Deposit (RDD; http://www.researchdata.org.cn) under approval number RDDB2026807816.
Supplementary Material: https://cancerbiometherapy.com/index.php/cbtt/libraryFiles/downloadPublic/44
Ethics approval and consent to participate
All animal experiments were conducted in accordance with the institutional guidelines and approved by the Animal Care and Use Committee of Sun Yat-sen University Cancer Center (Approval number: L102012020030M).
Research Integrity and Special Considerations: Authors declare that images have not been inappropriately manipulated or misrepresented.
Authors’ affiliations
1. State Key Laboratory of Oncology in South China, Collaborative Innovation Center for Cancer Medicine, Sun Yat-sen University Cancer Center, Guangzhou, China.
2. Department of Radiation Oncology, Sun Yat-sen University Cancer Center, Guangzhou, China.
3. Guangzhou Biotron Technology Co., Ltd., Guangzhou, China.
4. Laboratory of Clinical and Molecular Gastroenterology, Institute for Digestive Research, Lithuanian University of Health Sciences, Kaunas, Lithuania
CRediT authorship contribution statement
Zichen Qiu: Investigation, Data curation, writing—review and editing; Ning Meng: Methodology, Validation, Investigation, Data curation, writing—review and editing; Wenwen Ding: Investigation, Data curation, writing—review and editing; Rūta Steponaitienė: Investigation, writing—review and editing; Christophe Glorieux: Conceptualization, Validation, Supervision, writing—original draft, writing—review and editing, Funding acquisition.
ORCID ID
Zichen Qiu: https://orcid.org/0000-0003-2536-8816
Ning Meng: https://orcid.org/0000-0003-1308-9094
Wenwen Ding: https://orcid.org/0009-0002-6153-2126
Rūta Steponaitienė: https://orcid.org/0000-0001-6774-6657
Christophe Glorieux: https://orcid.org/0000-0003-1944-611X